The following graphs provide response time and availability data for FEMS emergency vehicles.
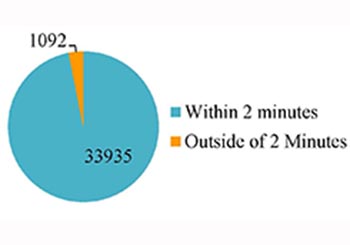
The first graph illustrates how quickly emergency vehicles begin responding to 9-1-1 calls. Commonly called “chute time,” this graph shows the number of times when fire trucks, ambulances and other vehicles take longer than two (2) minutes to begin responding on a call. “Chute time” is measured from the time when a call is dispatched, until the time when an emergency vehicle begins continuous travel to a call.
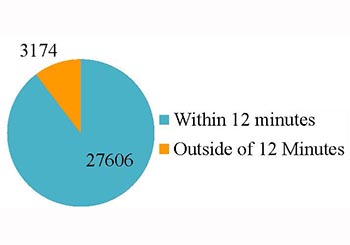
The second graph illustrates how quickly emergency vehicles respond to 9-1-1 calls. Commonly called “response time,” this graph shows the number of times when fire trucks, ambulances and other vehicles take longer than 12 minutes to arrive at a call. “Response time” is measured from the time when a call is dispatched, until the time when an emergency vehicle arrives at a call.
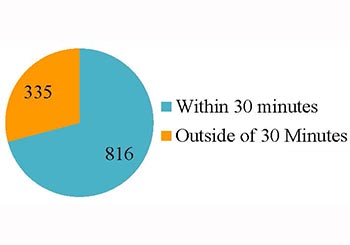
The third graph illustrates how often emergency vehicles are placed “out-of-service” and are unavailable to respond for 9-1-1 calls. This graph shows the number of times when emergency vehicles are placed “out-of-service” longer than thirty (30) minutes. Reasons for being placed “out-of-service” include refueling, restocking supplies, decontamination or other causes that would prevent an emergency vehicle from being able to safely respond for a 9-1-1 call.
For dates August 1 through August 31, 2015
Responder Departs
33935 Within 2 Minutes
1092 Outside of 2 Minutes
Responder Arrives
27606 Within 12 Minutes
3174 Outside of 12 Minutes
Out Of Service
816 Within 30 Minutes
335 Outside of 30 Minutes
Charts
Responder Departs
Responder Arrives
Out of Service