
Please view the FEMS Performance Charts with the descriptions below.
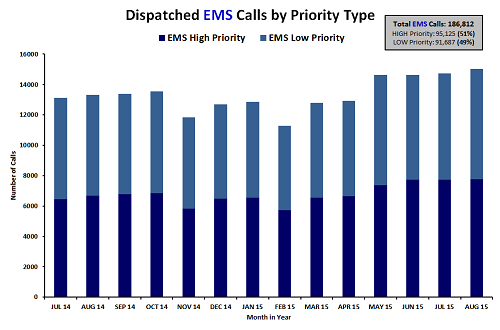
Chart 5: This graph shows how many medical calls occur each month, by dispatch priority. “Higher Priority” medical calls (like heart attacks, strokes and difficulty breathing) are shown in dark blue. “Lower Priority” medical calls (like minor injuries or illnesses) are shown in light blue.
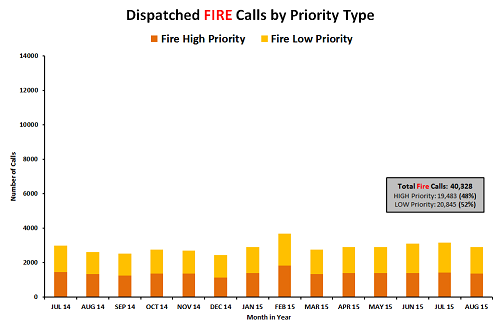
Chart 6: This graph shows how many fire and other calls occur each month, by dispatch priority. “Higher Priority” fire calls (like calls with flame and smoke visible) are shown in dark orange. “Lower Priority” fire calls (like checking a malfunctioning fire alarm) are shown in light orange.
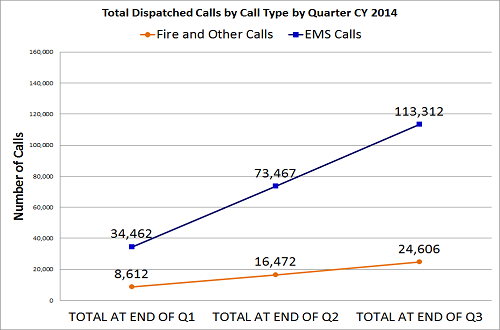
Chart 7: This graph compares the number of medical calls and fire calls by quarter during Calendar Year 2014.
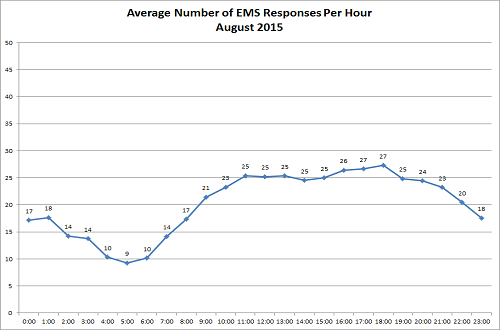
Chart 8: This graph shows the average number of medical calls by time of day.