EMS, Fire and Other incidents are dispatched to an identified address or location. Incident addresses and locations can be geospatially mapped by Engine Company first response areas. Incident addresses and locations can also be mapped using a “grid” system to better determine incident locations and response times. The “grid” system used for mapping is sub-divided into 300 meter by 300 meter “boxes.” Each “box” is approximately the size of a square city block. The system is comprised of 2,084 “grid boxes” completely covering the land and water area surrounding the District of Columbia.
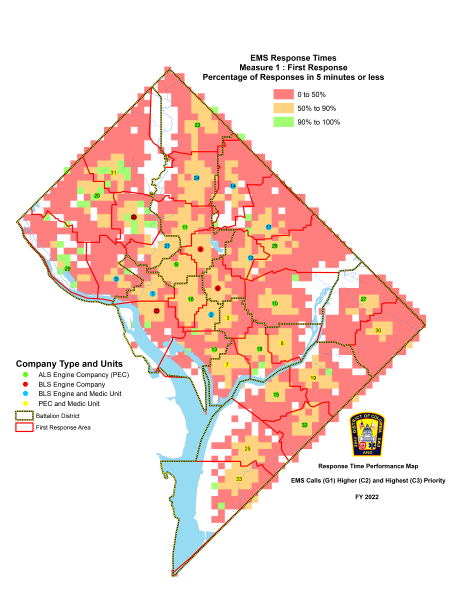
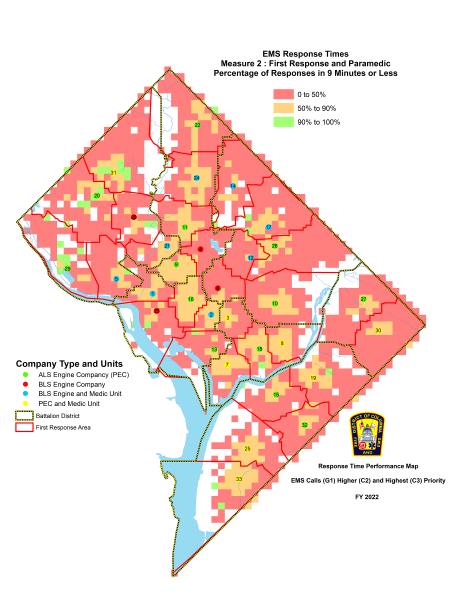
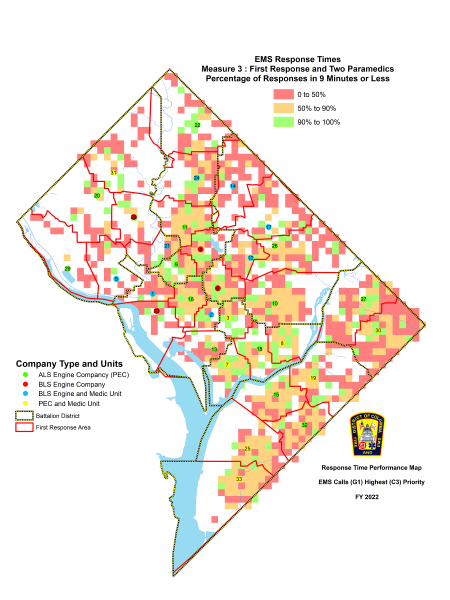
EMS Response Time Mapping by Engine Company First Response Area. EMS response times are not identically distributed across the District. Response time is dependent on time of day, weather, road conditions, traffic, pedestrian density and, most importantly, incident travel distance. If EMS call volume is high (or experiencing sudden “surge”) fewer emergency vehicles are available to respond for calls. Incident travel distance increases for remaining emergency vehicles, lengthening response times. Some fire stations are located closer to each other where the number of EMS calls in a first response area is high. This results in more emergency vehicles being concentrated in high EMS call volume areas. This greater concentration of resources improves capacity during peak EMS call load periods. Other fire stations are located farther away from each other where EMS call loads in first response areas are lower. This can lengthen incident travel distance and response time. The positioning of emergency vehicles in fire stations is limited by the location and size of stations. Larger stations (positioned in the central business district) can house more vehicles. Smaller stations (located in residential neighborhoods) cannot. The maps below show the distribution of EMS response times by each performance measure for the date range indicated. The maps below show the percentage distribution of EMS response times for each performance measure by Engine Company first response area and grid box, for the date range indicated.
EMS First Response Map: Percentage of high priority EMS calls when a first responding EMT arrived in 5 minutes or less (ALL of FY 2022).
EMS First Response and First Paramedic Map: Percentage of higher priority EMS calls when a first responding EMT arrived in 5 minutes or less and a Paramedic arrived in 9 minutes or less (ALL of FY 2022).
EMS First Response and 2 Paramedics Map: Percentage of highest priority EMS calls when a first responding EMT arrived in 5 minutes or less and two Paramedics arrived in 9 minutes or less (ALL of FY 2022).
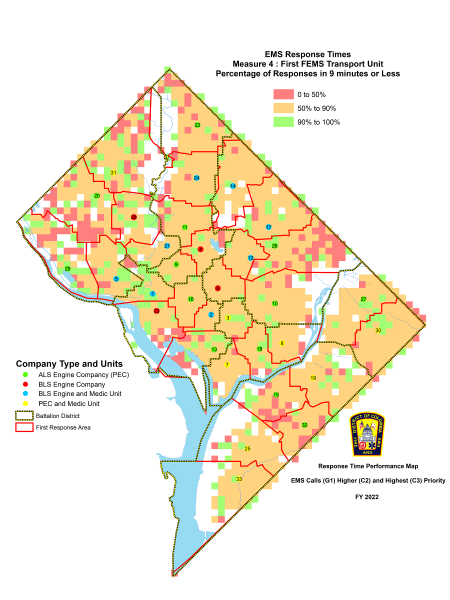
EMS First FEMS Transport Unit Map: Percentage of high priority EMS calls when a FEMS transport unit arrived in 9 minutes or less (ALL of FY 2022).
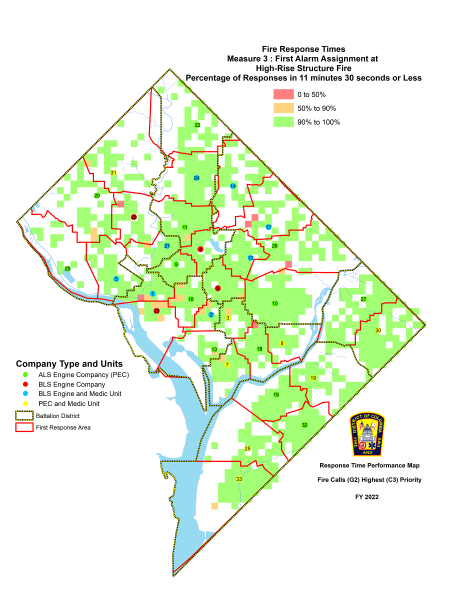
Fire Response Time Mapping by Engine Company First Response Area. Fire response times are not identically distributed across the District. Response time is dependent on time of day, weather, road conditions, traffic, pedestrian density and, most importantly, incident travel distance especially for “first alarm assignments.” Unlike other municipalities, FEMS uses a large first alarm assignment for all reported structure fires. This is because many residential structures are “attached” (such as row houses) preventing simultaneous front and back access to the interior of the structure from a single street. A majority of residential structures are also older (50 or more years), increasing the risk of rapid fire extension to multiple floors and adjoining structures. For FEMS, the most important measure of Fire response time performance is the arrival time of the first fire engine (Measure 1) followed by two additional engine companies and the first truck company (not included in NFPA Standard 1710 measures). FEMS first alarm assignment incident travel distances, especially in peripheral areas of the District, can be lengthy, resulting in longer overall response times.
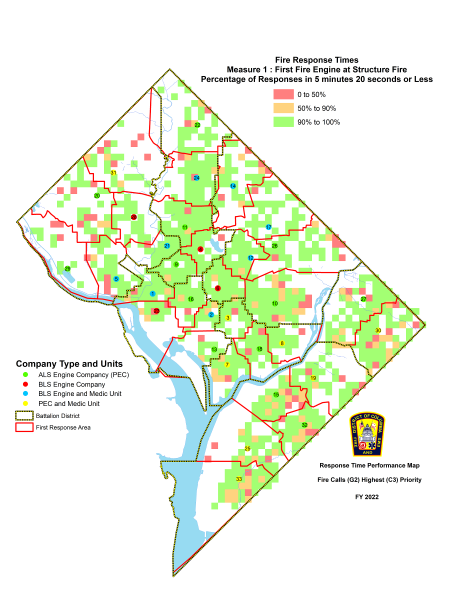
FIRE First Fire Engine: Percentage of structure fire calls when a first responding fire engine arrived in 5 minutes 20 seconds or less (ALL of FY 2022).
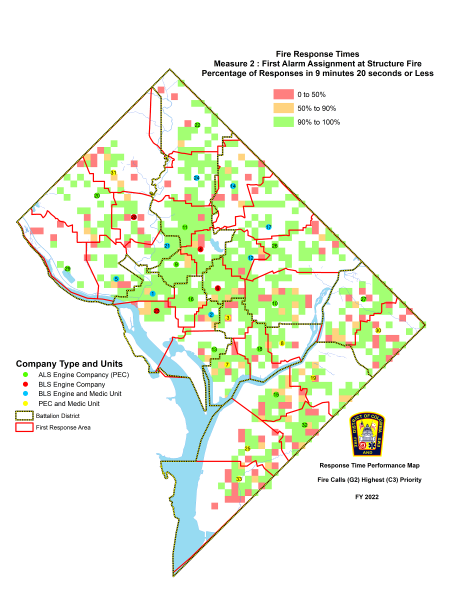
FIRE First Alarm: Percentage of structure fire calls when a first alarm assignment arrived in 9 minutes 20 seconds or less (ALL of FY 2022).
FIRE First Alarm (High Rise): Percentage of high-rise structure fire calls when a first alarm assignment arrived in 11 minutes 30 seconds or less (ALL of FY 2022).