
Starting in March 2016, the Fire and Emergency Medical Services Department (FEMS) began tracking transport unit availability to better monitor Emergency Medical Services (EMS) system capacity. Advanced life support (ALS) Medic Units and basic life support (BLS) Ambulances both respond to fire and EMS calls. Each dispatched EMS call is assigned a Medic Unit or Ambulance (or together, transport units) to provide patient transport if needed. Response time to EMS calls by transport units is dependent on unit location and response conditions. Response time is also dependent on the number of transport units available for responding to EMS calls. When transport unit availability (or TUA) is low, Medic Units and Ambulances often travel further distances to EMS calls, increasing response times. In some cases, especially highest priority EMS calls with “immediately life threatening” patient conditions, lengthy response times increase patient risk.
To evaluate TUA from FY-17 (beginning 10/01/2016) and forward, FEMS started tracking Medic Unit and Ambulance availability each minute of the day during each year. FEMS determined a minimum number of Medic Units, Ambulances and total transport units needed to be available for responding on EMS calls based on detailed analysis of response times and distances. A transport unit is available for responding to a call if it is not assigned to another call, or otherwise unable to respond on calls. The minimum number of available transport units (or availability “floors”) is as follows:
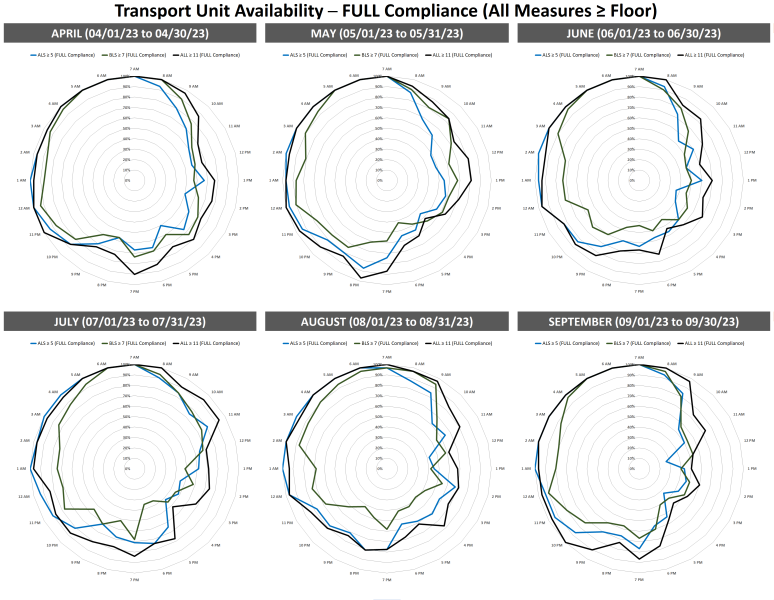
- ALS Medic Units (17 regularly in service) – 5 or more available for responding to EMS calls.
- BLS Ambulances (26 regularly in service) – 7 or more available for responding to EMS calls.
- All Transport Units (43 regularly in service) – 11 or more available for responding to EMS calls.
From FY-17 to FY-23 (beginning 10/01/2021), FEMS monitored transport unit availability floors by counting the number of minutes TUA was at or above availability floors per week, divided by total minutes during a week to calculate a percentage of compliance. Charts detailing TUA from FY-17 and forward by transport unit type are shown below.
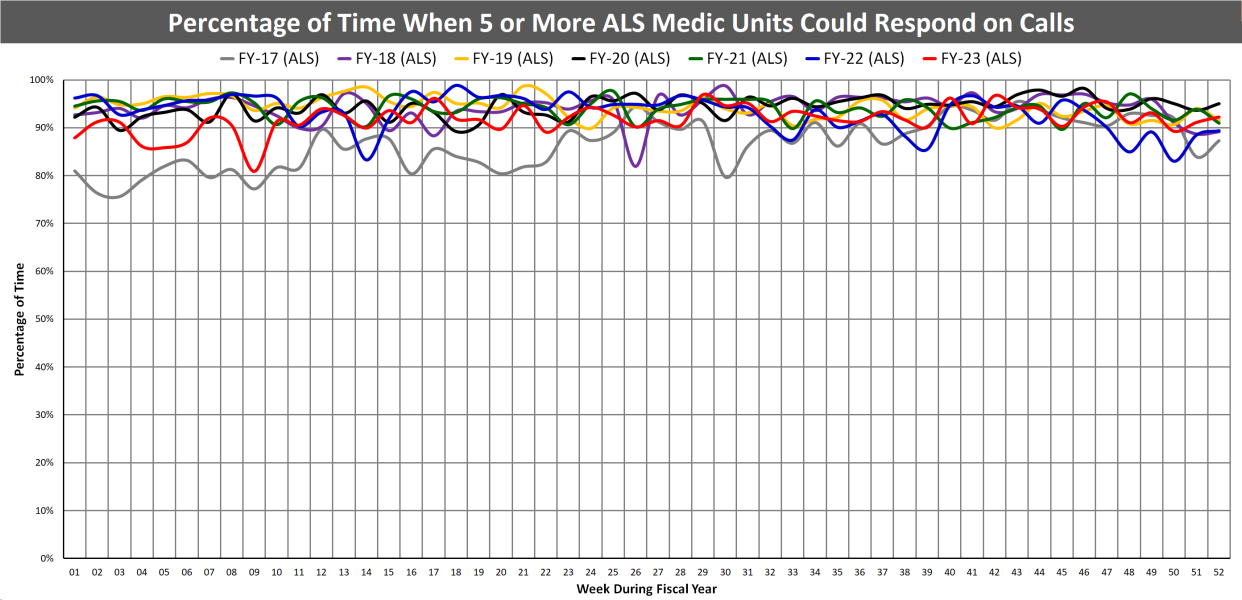
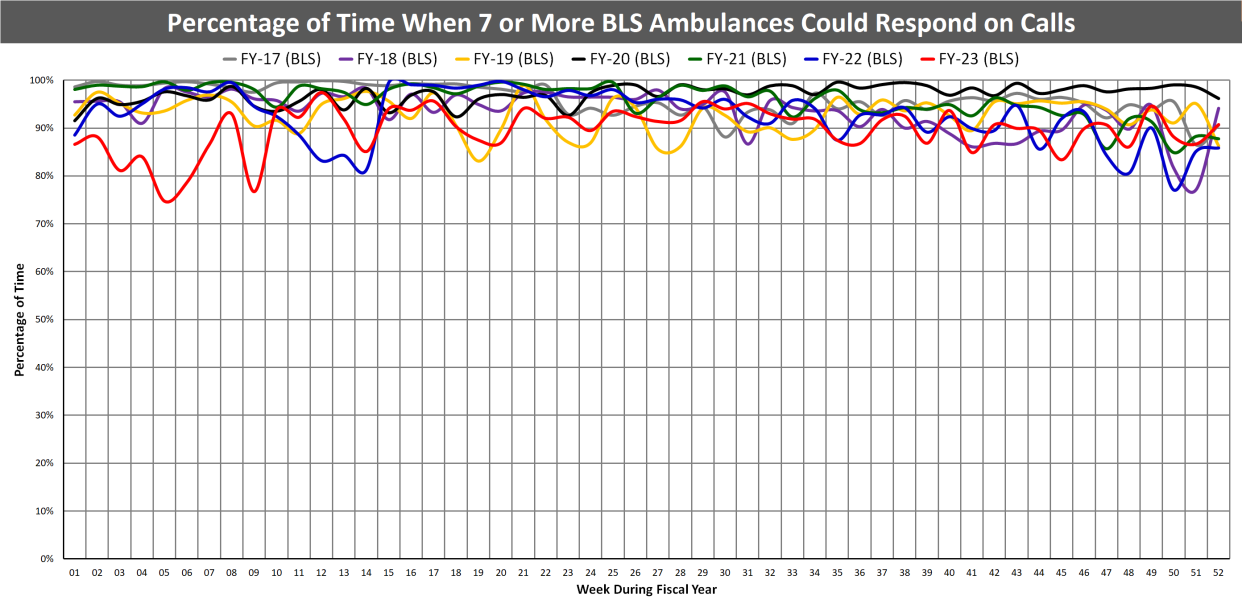
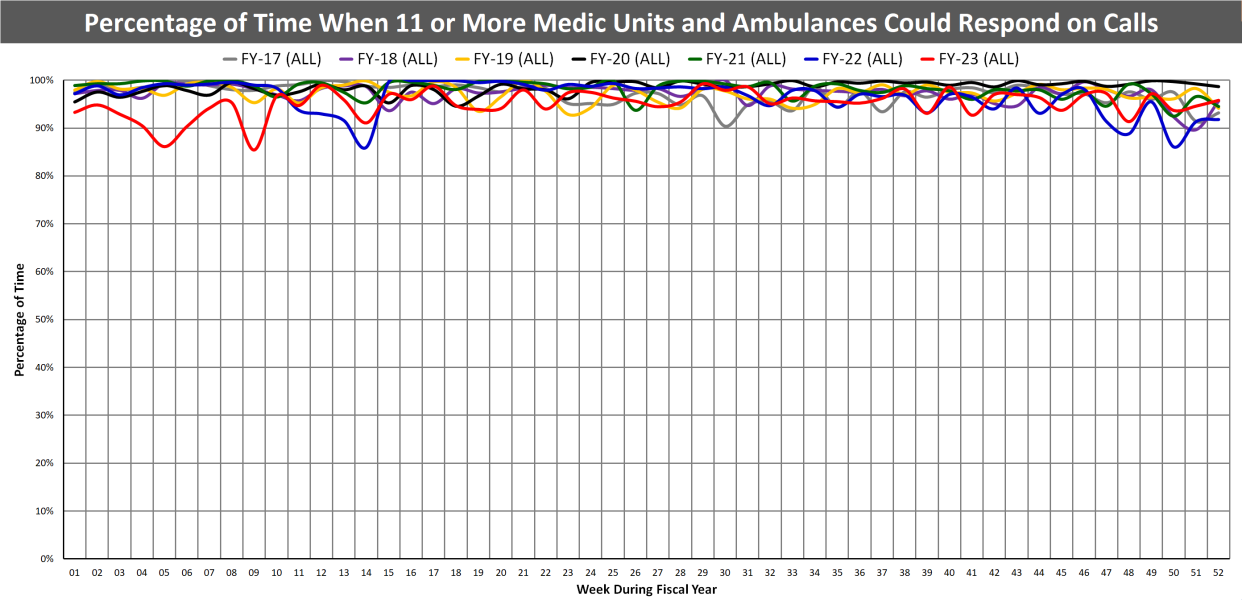
Complete reports showing percentage of compliance with TUA availability floors by week and fiscal year are linked below. These reports show a range of weekly transport unit availability and the percentage of full compliance with TUA availability floors.
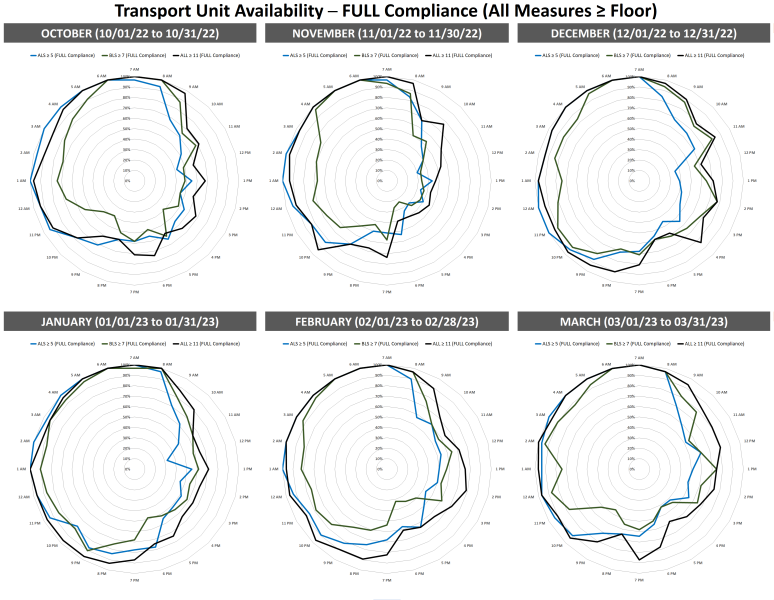
From FY-21 (beginning 10/01/2020) and forward, FEMS expanded the monitoring of transport unit availability floors by counting the number of minutes TUA was at or above availability floors per day, along with measuring average (mean), minimum and maximum TUA by hour as follows:
- Average Availability Count – this represents the average (mean) number of available transport units during an hour, measured for the hour (60 minutes).
- Minimum Availability Count – this represents the minimum number of available transport units during an hour, measured by minute. If TUA drops to zero for only one minute during an hour, minimum TUA is zero.
- Maximum Availability Count – this represents the maximum number of available transport units during an hour, measured by minute. If TUA increases to 43 for only one minute during an hour, maximum TUA is 43.
The above measures “buffer” the minute-by-minute substantial variability of TUA, allowing for easier analysis by hour. The average (mean) measure establishes a “base” during an hour, while the minimum and maximum measures establish a “range” for hourly data. Using this, FEMS now completes “compliance assessment” of TUA availability floors by hour of the day as follows:
- Full Compliance – minimum, maximum, and average transport unit availability counts are all greater than or equal to a TUA availability floor.
- Partial Compliance – one or more measures of minimum, maximum or average transport unit availability counts is less than a TUA availability floor.
- Non-Compliance – minimum, maximum and average transport unit availability counts are all less than a TUA availability floor.
Using the above methodology, FEMS monitors monthly TUA compliance by hour providing better insight to when transport unit availability is compliant with floors. Charts detailing full compliance with TUA availability floors by month and hour of the day (for all hours in a month) are shown below.
Complete reports showing full and partial compliance with TUA availability floors by month and fiscal year are linked below. These reports show full and partial compliance with TUA availability floors by month and hour of the day (for all hours in a month), full and partial compliance with TUA availability floors by year and hour of the day (for all hours in a year), and full and partial compliance with TUA availability floors by weekday and hour of the day (for all hours in a year).
Complete reports showing full, partial and non-compliance with TUA availability floors by day and month are linked below. These reports show full, partial and non-compliance with TUA availability floors by date (for all days in a month), and full, partial, and non-compliance with TUA availability floors by hour and date including average (mean), minimum, and maximum measures to establish compliance assessment (for all hours and days in a month).