
Please view the FEMS Performance Charts with the descriptions below.
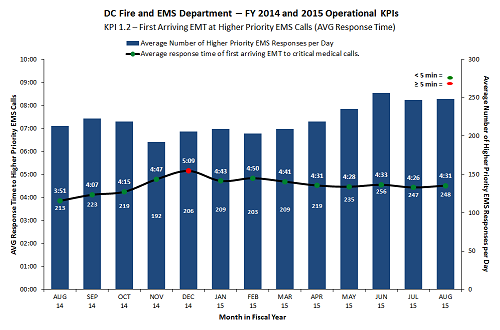
Chart 1: This graph shows the average response time of the first arriving EMT to “Higher Priority” medical calls by month (the black line with green and red dots) and the average “Higher Priority” medical call count by day during the same month (the blue bars). Green data points are less than 5 minutes, red data points are equal to or longer than 5 minutes. For example, during July, 2013, the average response time by the first arriving EMT was 4 minutes and 2 seconds to an average daily count of 202 “Higher Priority” medical calls. The Fire and EMS Department eliminated response delays to medical calls previously experienced by ambulances and fire trucks beginning in November, 2013.
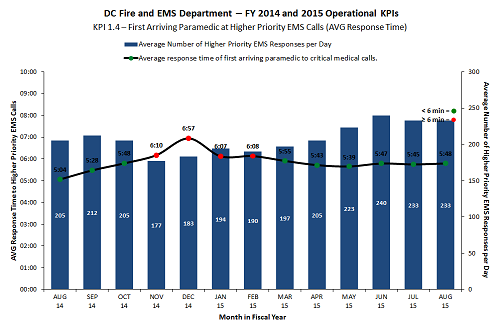
Chart 2: This graph shows the average response time of the first arriving Paramedic to “Higher Priority” medical calls by month (the black line with green and red dots) and the average “Higher Priority” medical call count by day during the same month (the blue bars). Green data points are less than 6 minutes, red data points are equal to or longer than 6 minutes. For example, during July, 2013, the average response time by the first arriving Paramedic was 5 minutes 34 seconds to an average daily count of 188 “Higher Priority” medical calls. The Fire and EMS Department eliminated response delays to medical calls previously experienced by ambulances and fire trucks beginning in November, 2013.
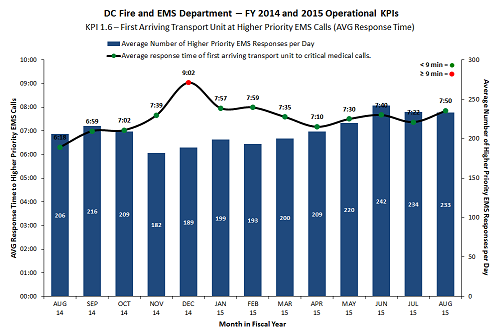
Chart 3: This graph shows the average response time of the first arriving Transport Unit (Ambulance) to “Higher Priority” medical calls by month (the black line with green and red dots) and the average “Higher Priority” medical call count by day during the same month (the blue bars). Green data points are less than 9 minutes, red data points are equal to or longer than 9 minutes. For example, during July, 2013, the average response time by the first arriving Transport Unit (Ambulance) was 6 minutes 41 seconds to an average daily count of 194 “Higher Priority” medical calls. The Fire and EMS Department eliminated response delays to medical calls previously experienced by ambulances and fire trucks beginning in November, 2013.
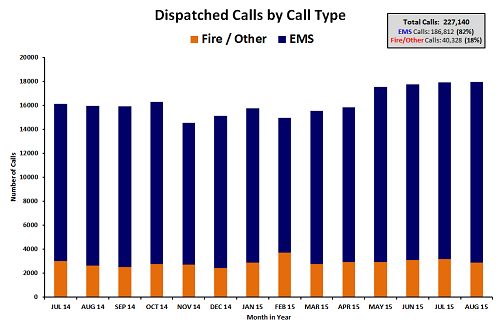
Chart 4: This graph shows how many medical and fire calls occur each month. Medical calls are shown in blue. Fire and other calls are shown in orange.