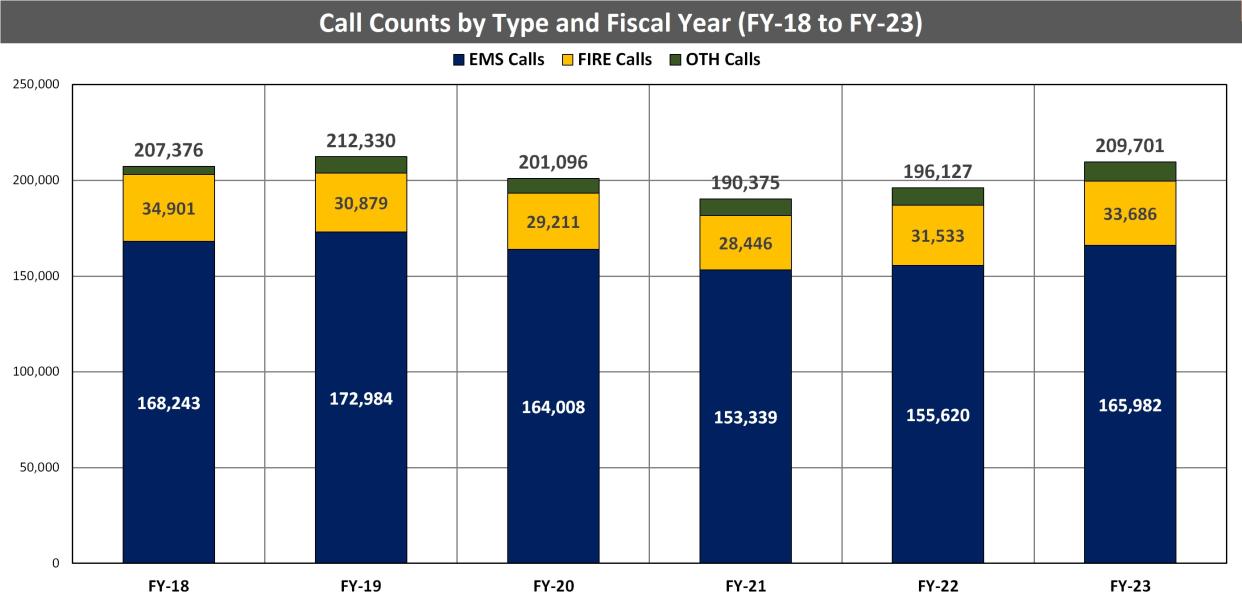
The chart below shows call volume by fiscal year (October to September). Call Groups include EMS (G1), Fire (G2) and Other (G3), as described by the FEMS call categorization system (please click here to view). Differences in call counts by year can be attributed to many factors, including changes in call coding.
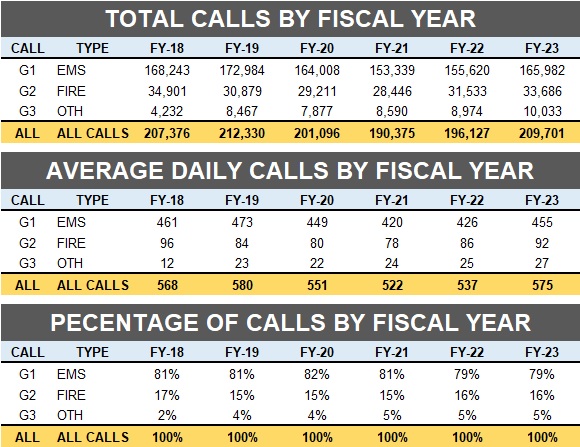
The tables below show call volume by fiscal year, average daily calls, and percentage of calls by Groups.
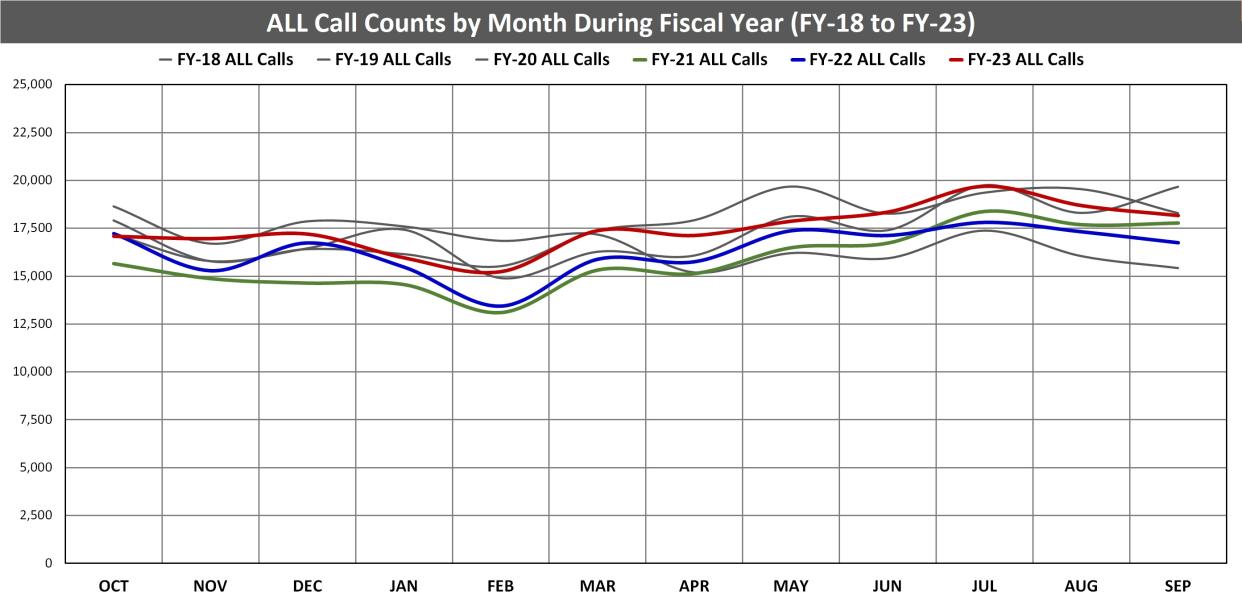
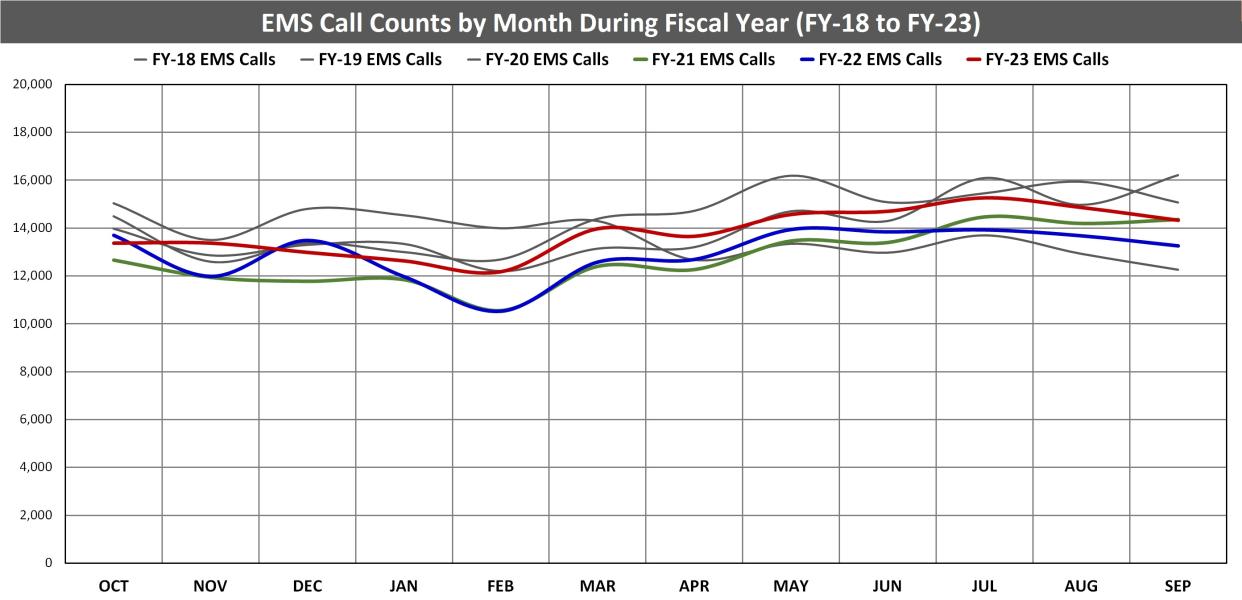
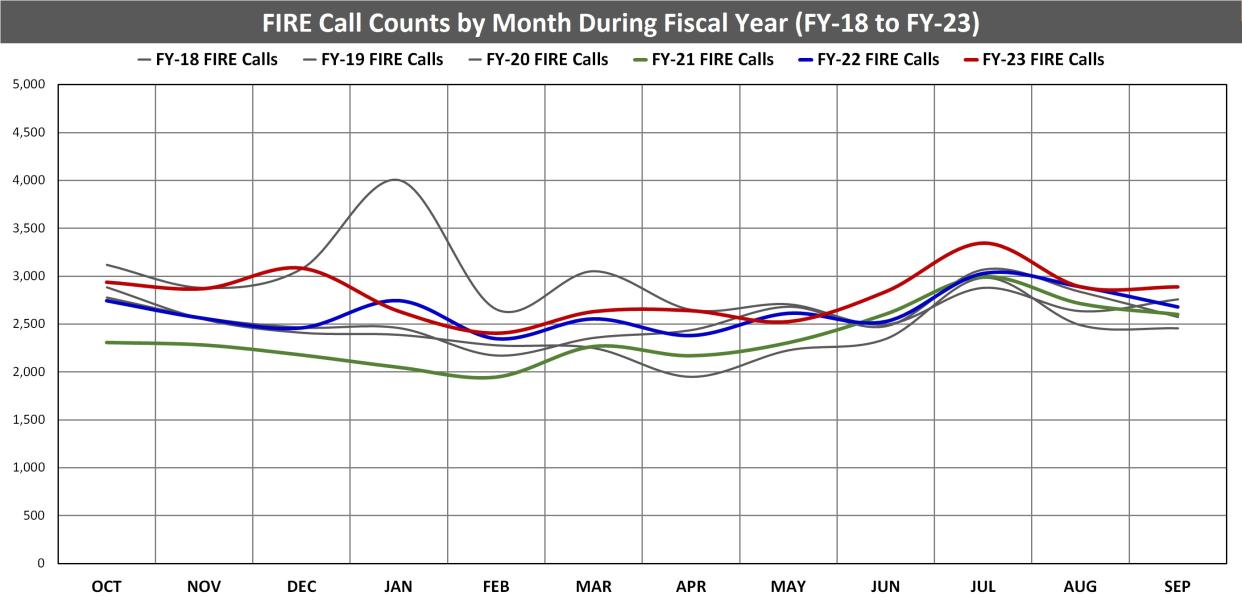
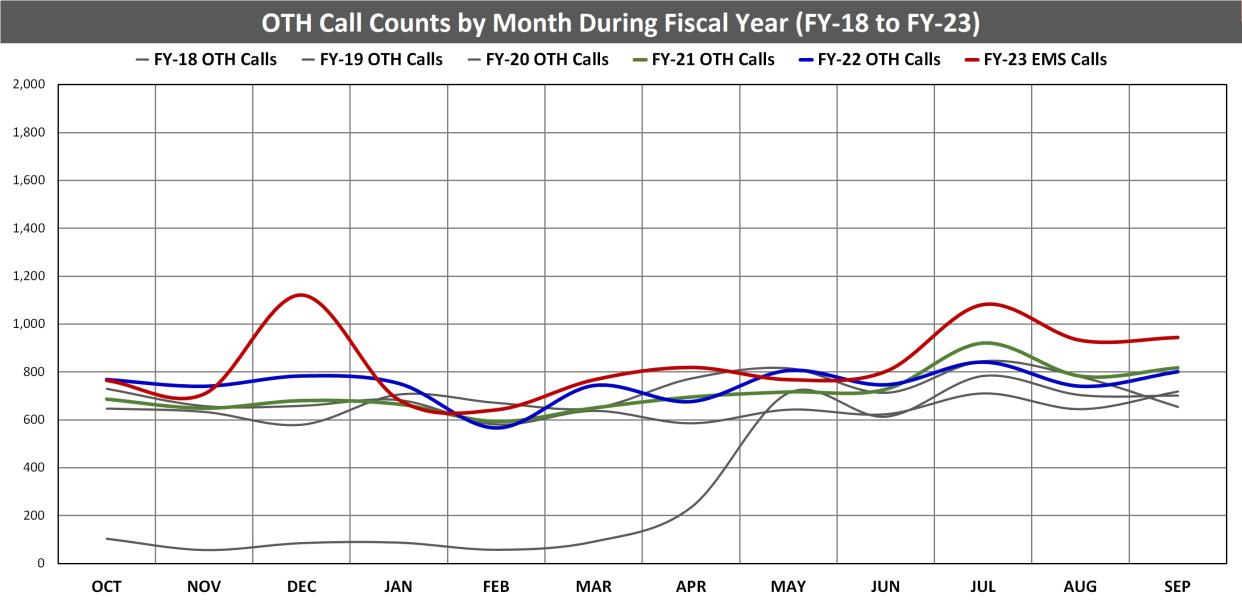
The charts below show call volume by month and fiscal year. Red is the current fiscal year, blue is the most recent fiscal year and green is the previous fiscal year. Differences in call counts by month and year can be attributed to many factors, including changes in call coding.
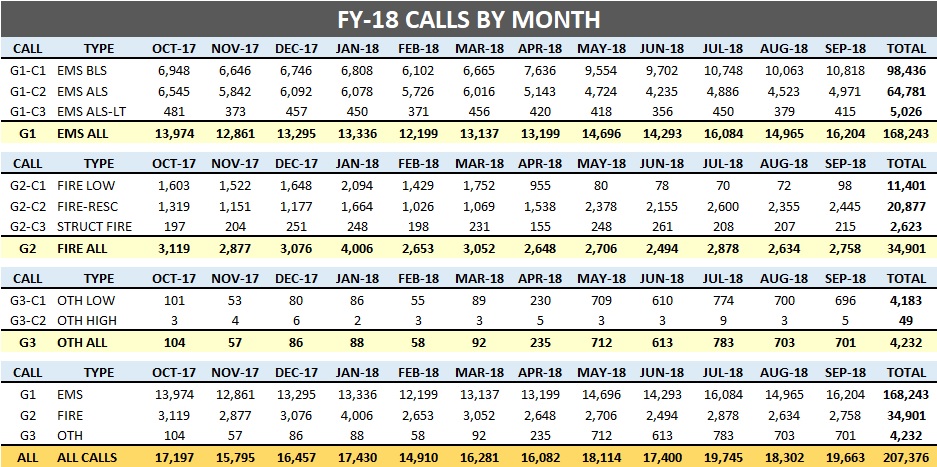
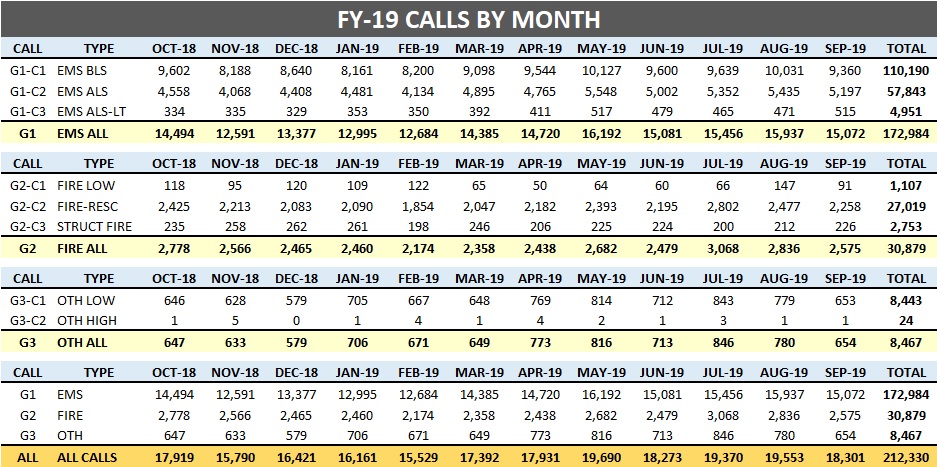
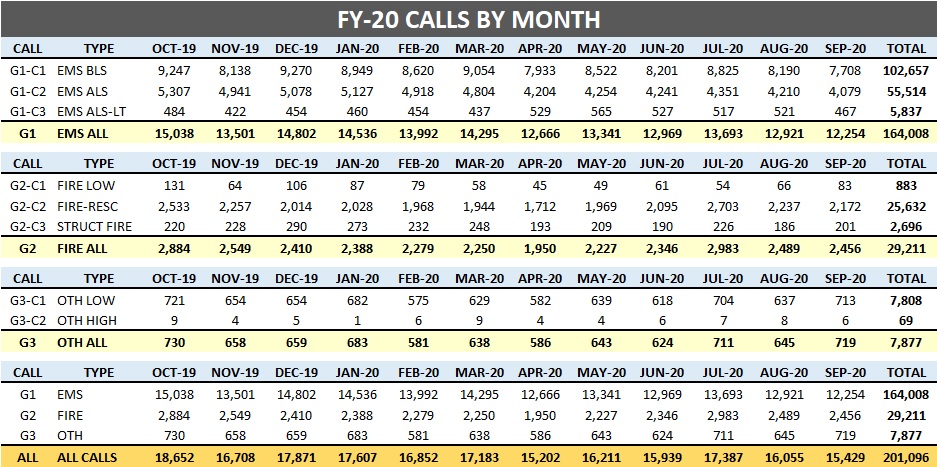
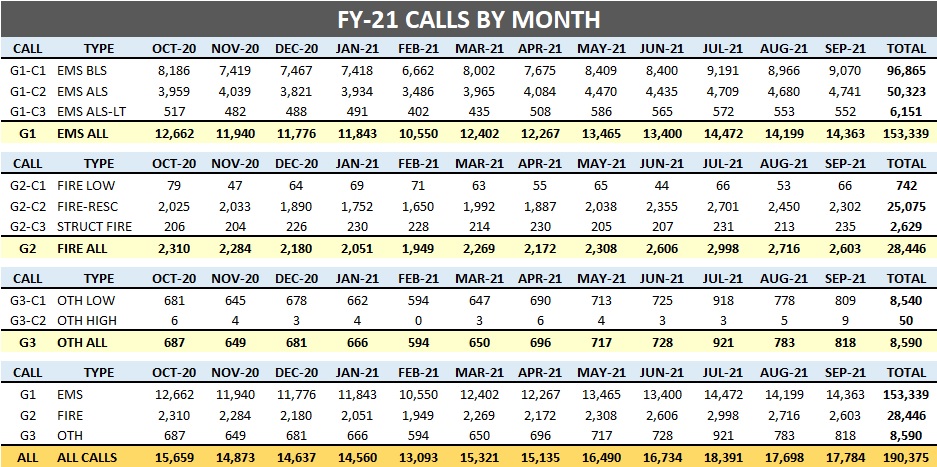
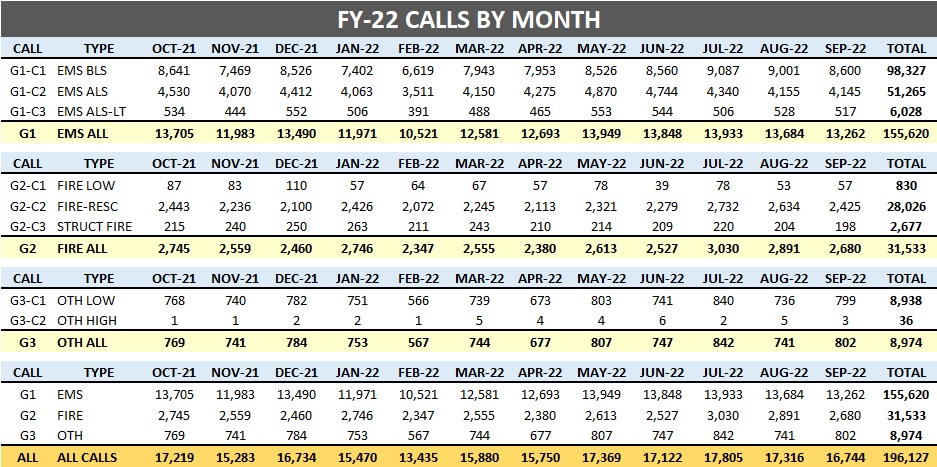
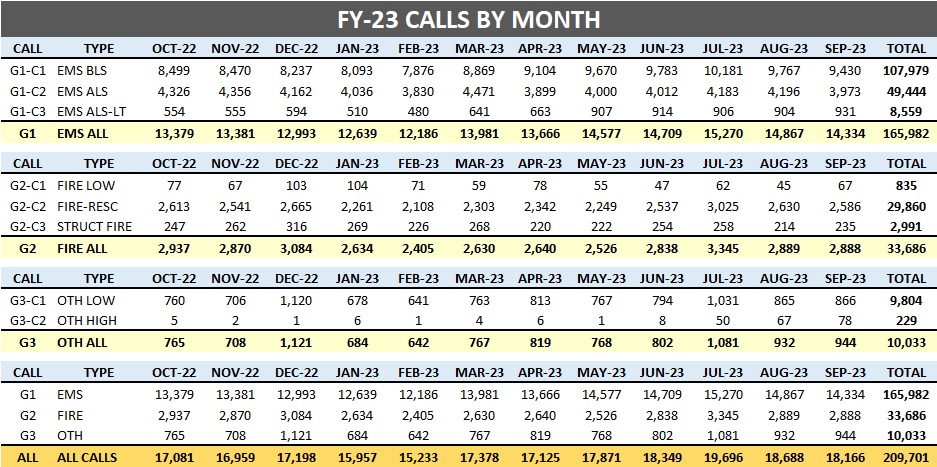
The tables below show call volume by month and fiscal year. Each call Group and Classification is shown. For EMS calls (G1), Classifications include BLS (C1), ALS (C2) and ALS-LT (C3). For Fire calls, Classifications include LOW (C1), FIRE-RESC (C2), and STRUCT FIRE (C3). For Other calls, Classifications include LOW (C1), and HIGH (C2). Each table contains the completed call volume for a fiscal year.